Story
Story
Story
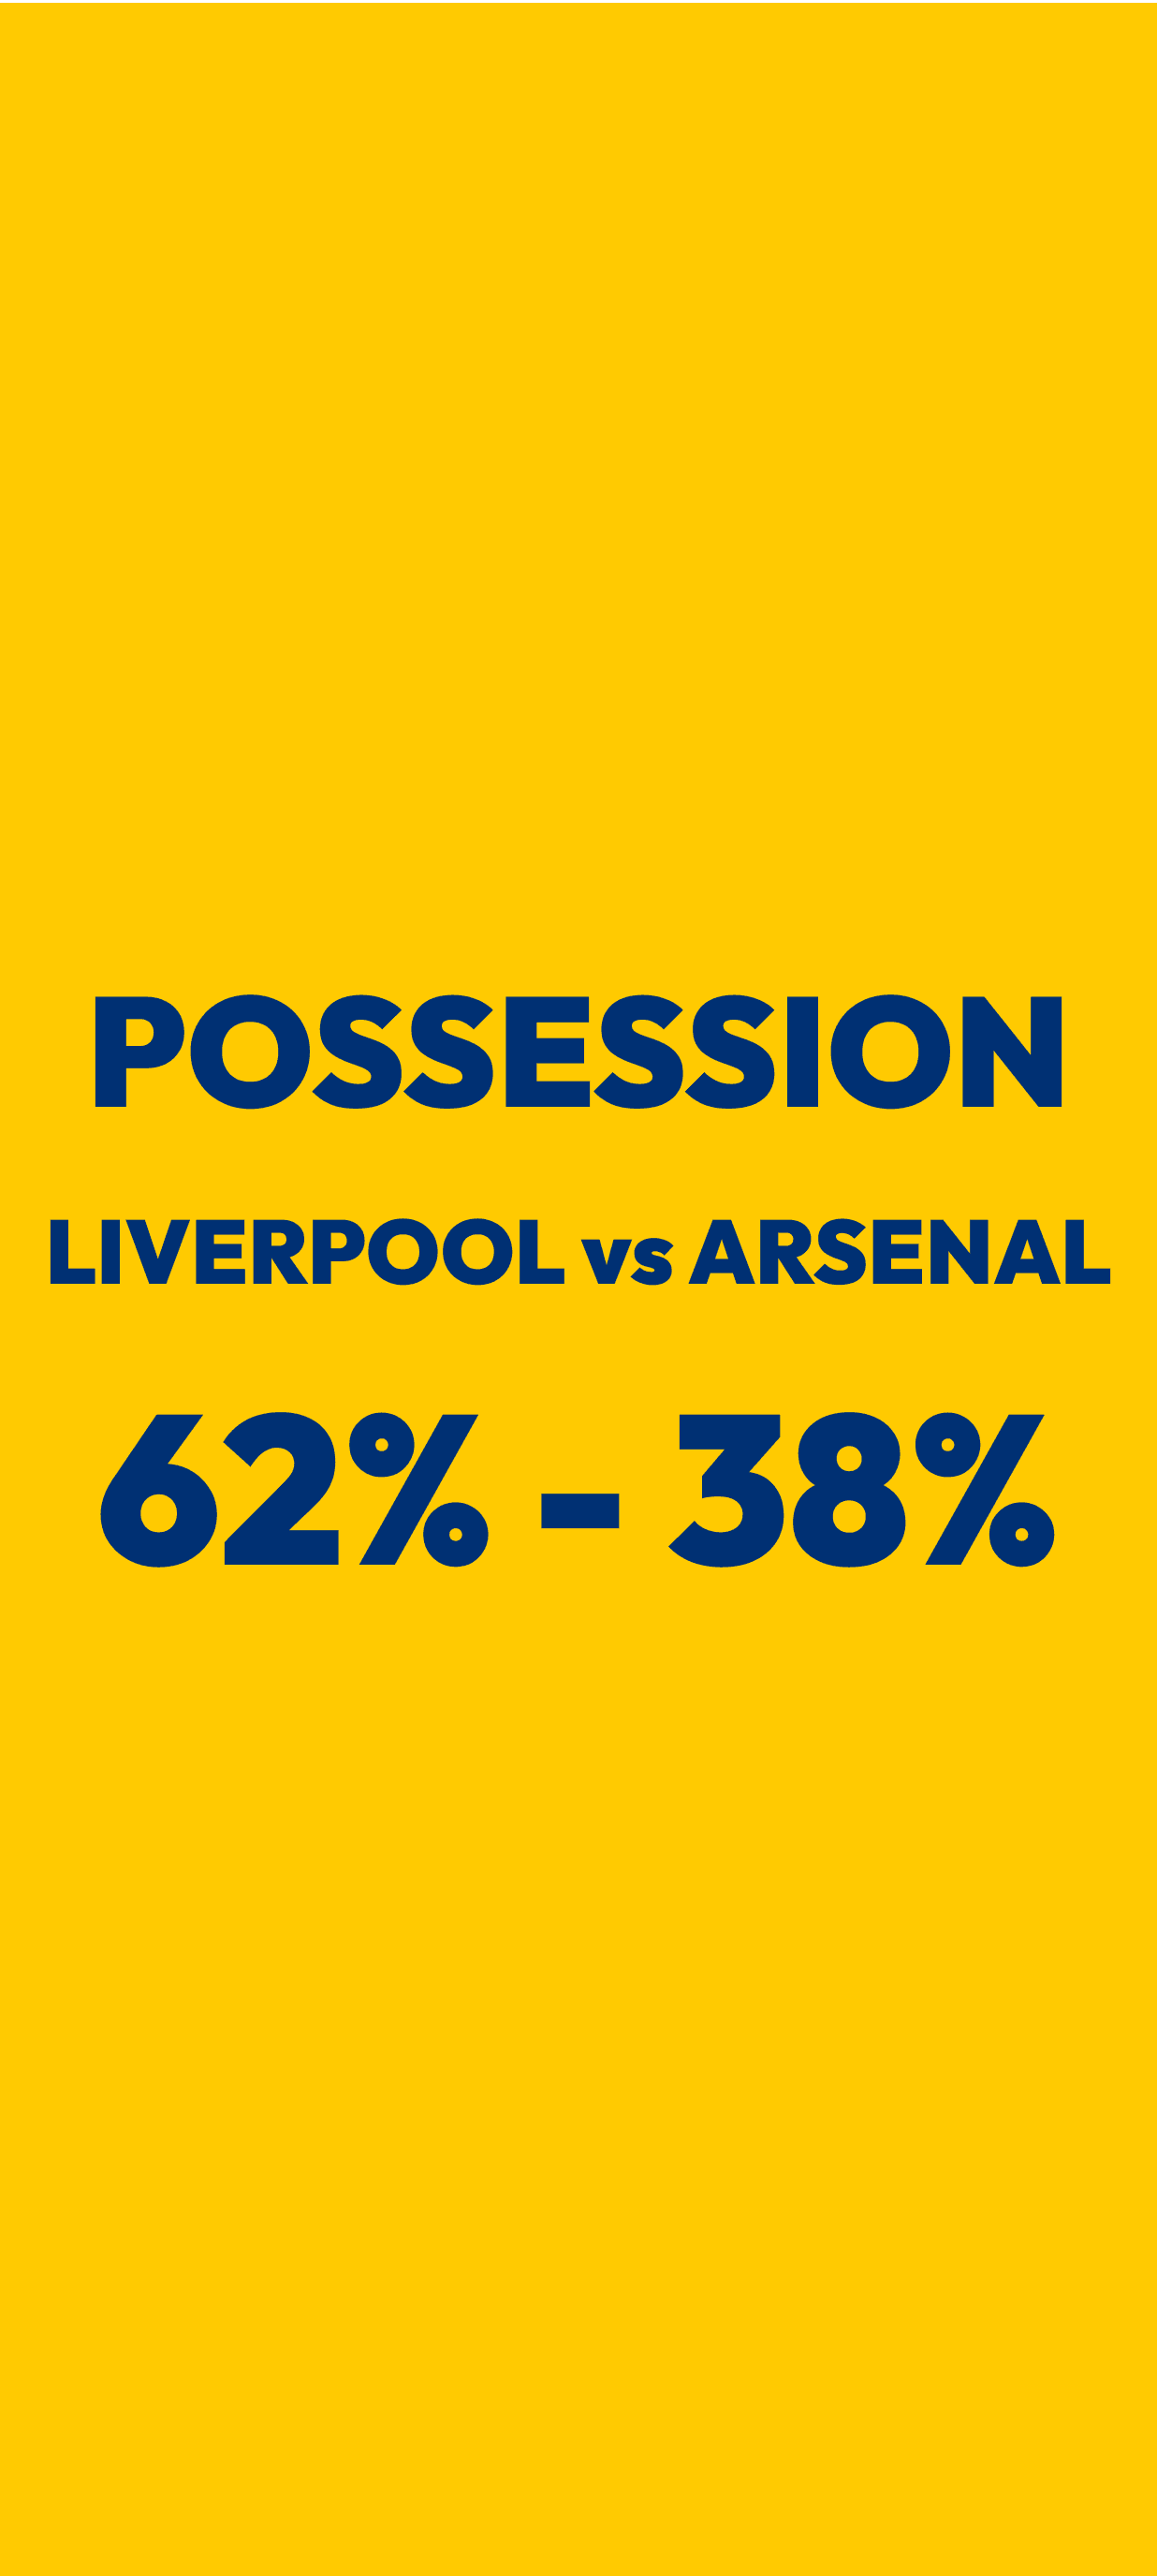
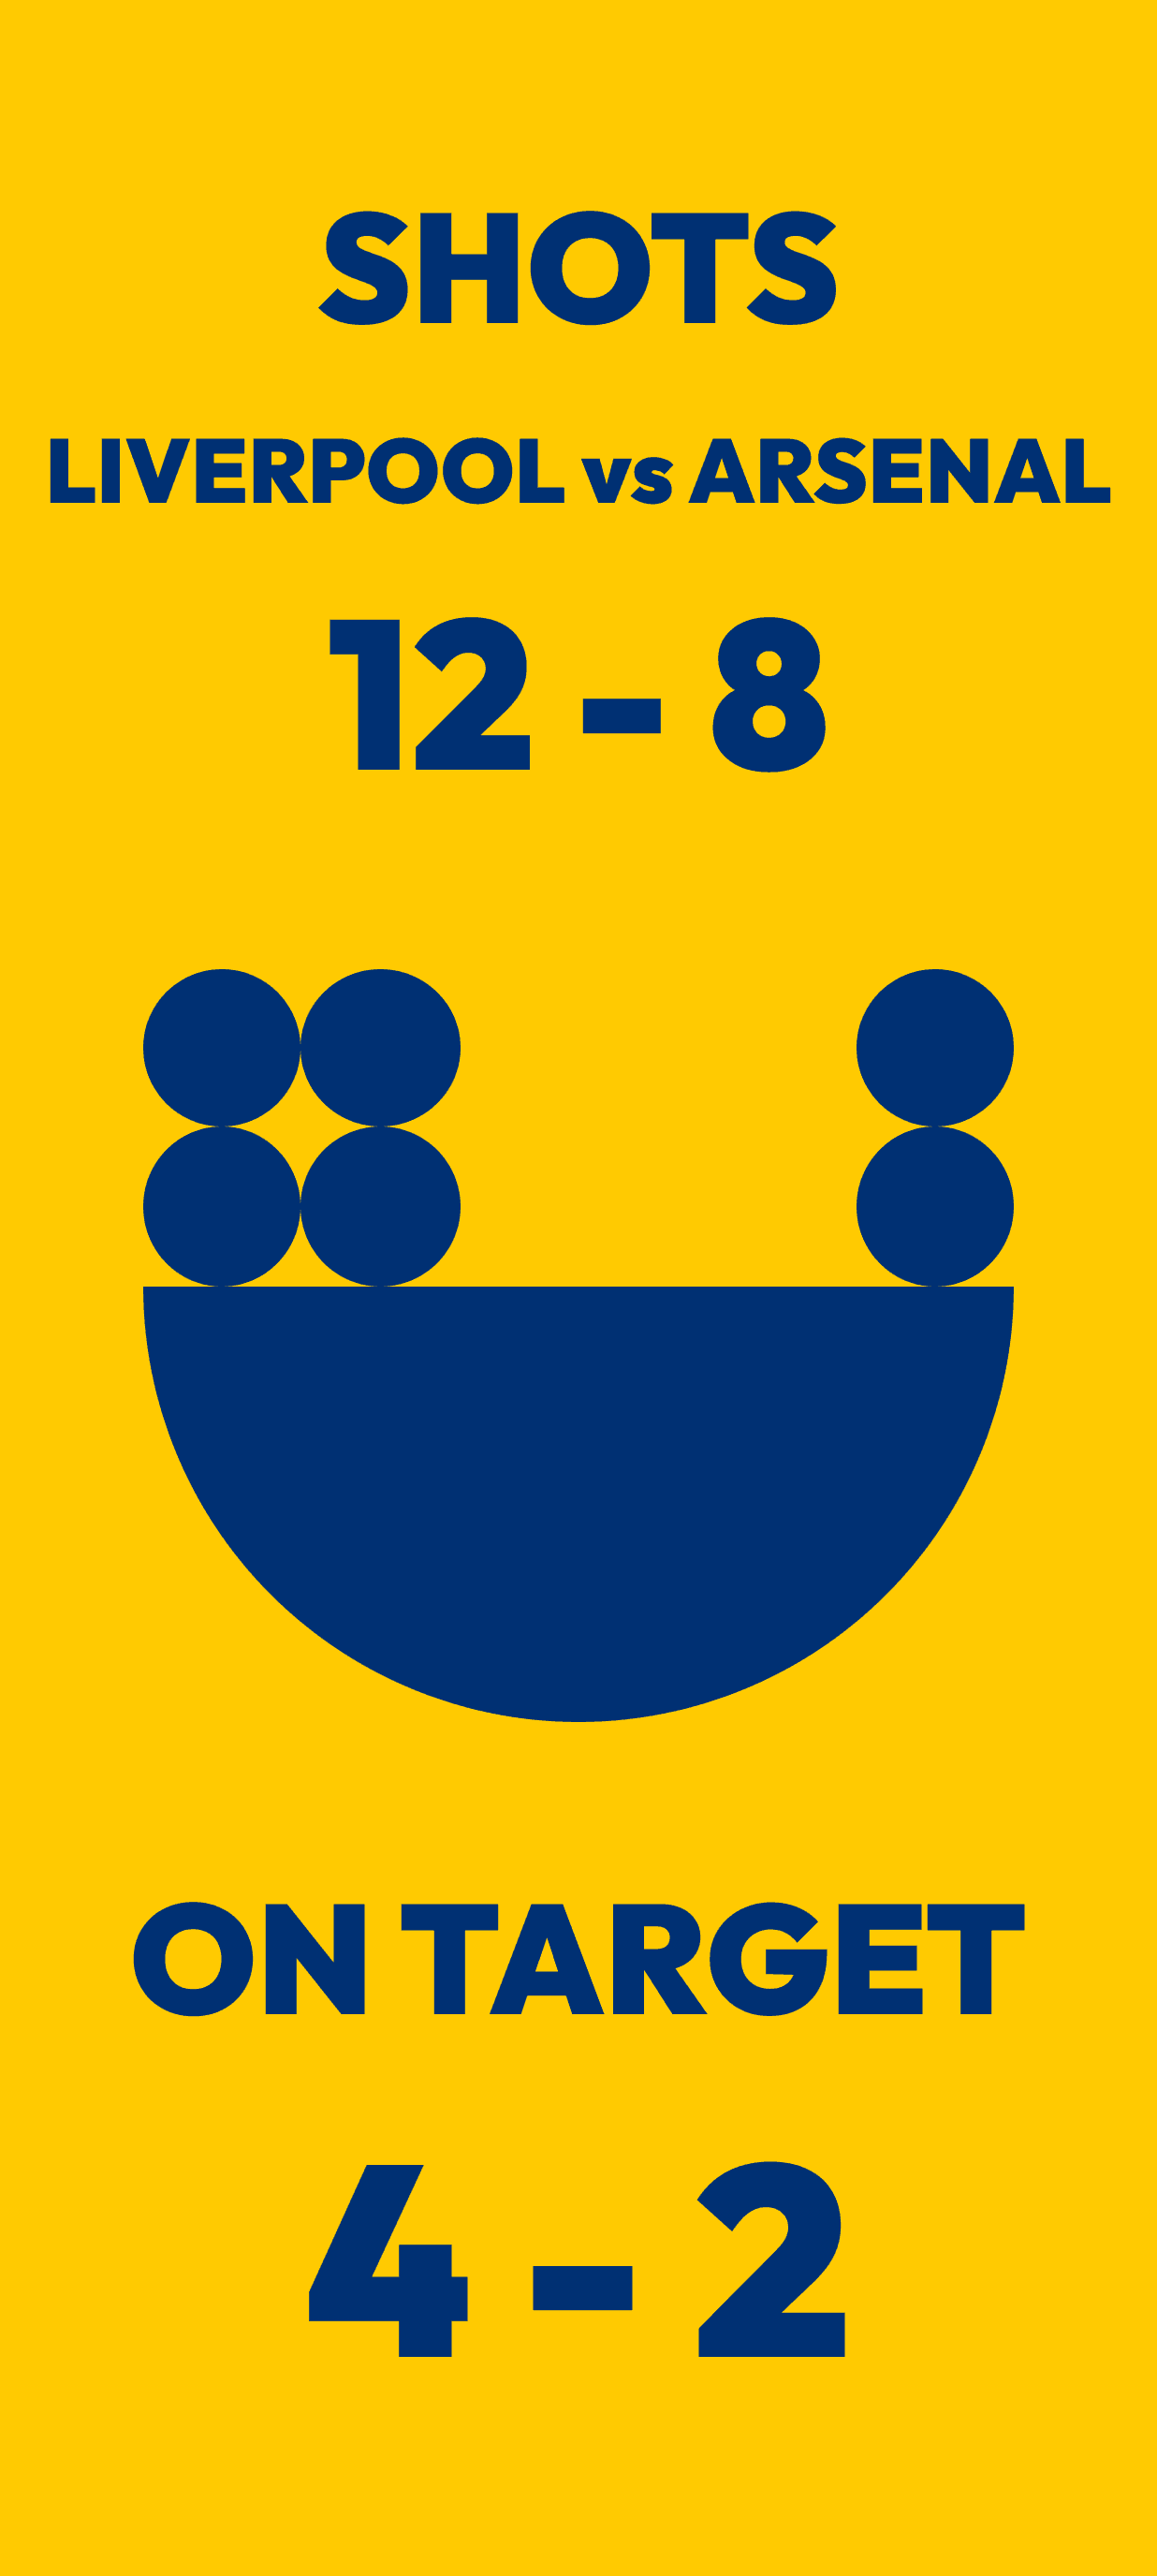
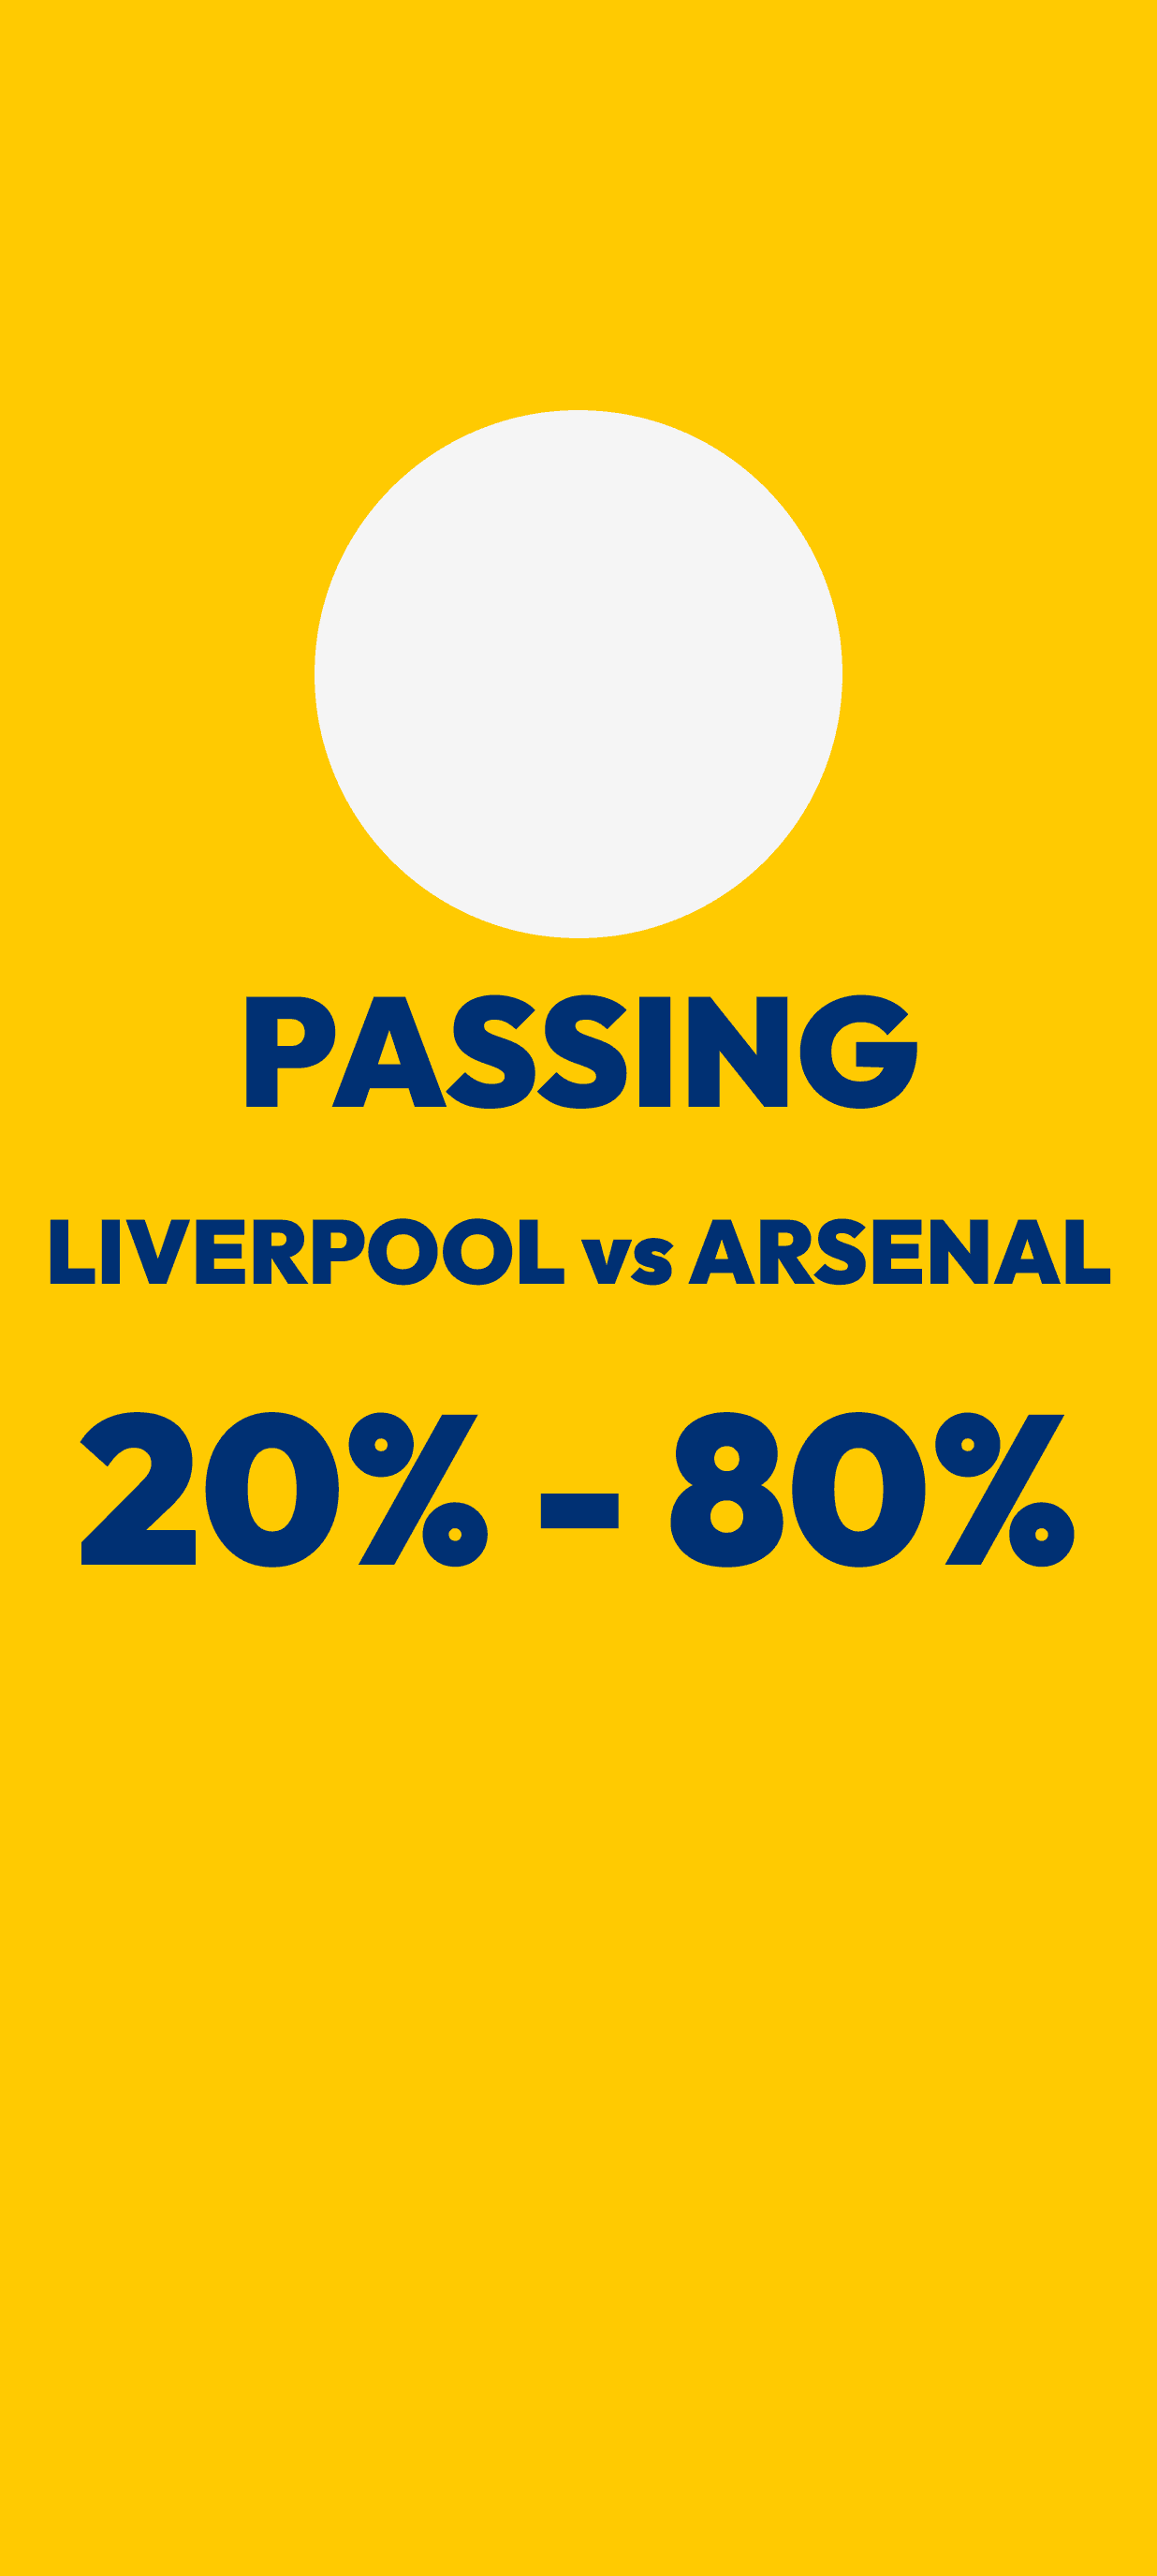
This project focuses on creating visually dynamic billboard graphics and animations to simplify complex soccer statistics, making them accessible to a broad audience on the go. Designed for high visibility in public spaces like subways, trams, and urban billboards, it highlights key performance metrics such as goals, assists, shots, and player statistics sourced from real-time data platforms.
The design prioritizes clarity and impact, using bold colors, clear typography, and concise animations to deliver information at a glance. These visuals ensure effortless comprehension for diverse audiences, from casual fans to professionals, enhancing their understanding and appreciation of the game.
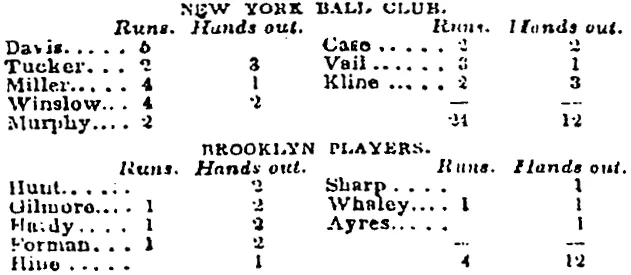
Inspired by the simplicity of early baseball statistics created by Henry Chadwick, this project reimagines data presentation as engaging, mobile-friendly visuals that transform raw data into compelling, easy-to-digest narratives.


Design
My aim was to create an easily decipherable design, accessible even to non-sports enthusiasts. In my opinion, it’s beneficial to stay knowledgeable, regardless of whether you actively participate in or enjoy a particular sport.


